General Transit Feed Specification (GTFS) Digest#
The goal of this website is to give you an overview of transit operators that produce GTFS schedule and/or real-time data either on the individual operator, Caltrans district, or legislative district level.
We use data from the National Transit Database, National Association of City Transportation Official’s Transit Route Types, and GTFS feeds to deliver key insights. You can find details such as the types of routes and the total scheduled hours of public transit service for which an operator runs.
For operators who produce real-time data, we also calculate additional performance metrics for all their routes. Examples include displaying the number of on-time, early, and late trips, the average speed, and the headway for a route.
GTFS Digest will continue to evolve as we dive into our own data warehouse!
Definitions and Methodology#
To read about the methodology behind and the definitions of terms used throughout our work, please visit here.
Frequently Asked Questions#
Why are the time-series tables sampling single days? GTFS provides us with extremely detailed information, such as the time a bus is scheduled to arrive at a stop, and the GPS coordinates of a bus at a given timestamp. When working with granular data like this, a single day statewide can be a very large table.
For context, on our sampled date in January 2024 there were 100k+ trips and 3.6 million+ stop arrivals, and that’s just scheduled data. Our vehicle positions table genereated in real-time, after deduplicating in our warehouse, had 15 million+ rows. On top of that, each operator can have a quartet of GTFS data (1 schedule table + 3 real-time tables).
Getting our pipeline right is fairly complex for a single day. Our warehouse has a set of internal keys to ensure we’re matching trip for trip across quartets. If you factor in the fact that operators can update their GTFS feeds at any time in the month, there are a lot of things that are changing!
We do have monthly aggregations on our roadmap, but for now, we’re building out our own time-series tables of processed data, and working through the kinks of being able to track the same route over time (as feeds get updated, identifiers change, etc). We will be starting with schedule data to figure out how to produce monthly aggregations in a scalable way.
How does GTFS Digest fit into SB 125 performance metrics?
SB 125 and the creation of the Transit Transformation Task Force has a section on creating performance metrics for transit operators statewide. Dive into the legislative bill.
The Caltrans Division of Data & Digital Services has been ingesting and collecting GTFS data in our warehouse since 2021. Our own internal effort has been to create data pipelines so that the rich and comprehensive data we collect can be processed and made available for public consumption.
There are overlaps with the goals of SB 125. There are a set of performance metrics that could be of interest to the task force, the public, and us! However, GTFS Digest is a GTFS digest, which means its primary focus is on metrics that can be derived purely from GTFS, and to do it statewide so we can understand transit operator performance. We based a lot of our metrics on the papers by Professor Gregory Newmark that gave us a roadmap of metrics that could be derived solely from GTFS that would create comparisons of transit operators regardless of size, service area and density.
Data Sources#
The GTFS Digest is comprised of four major datasets. The processing of the datasets is detailed below.
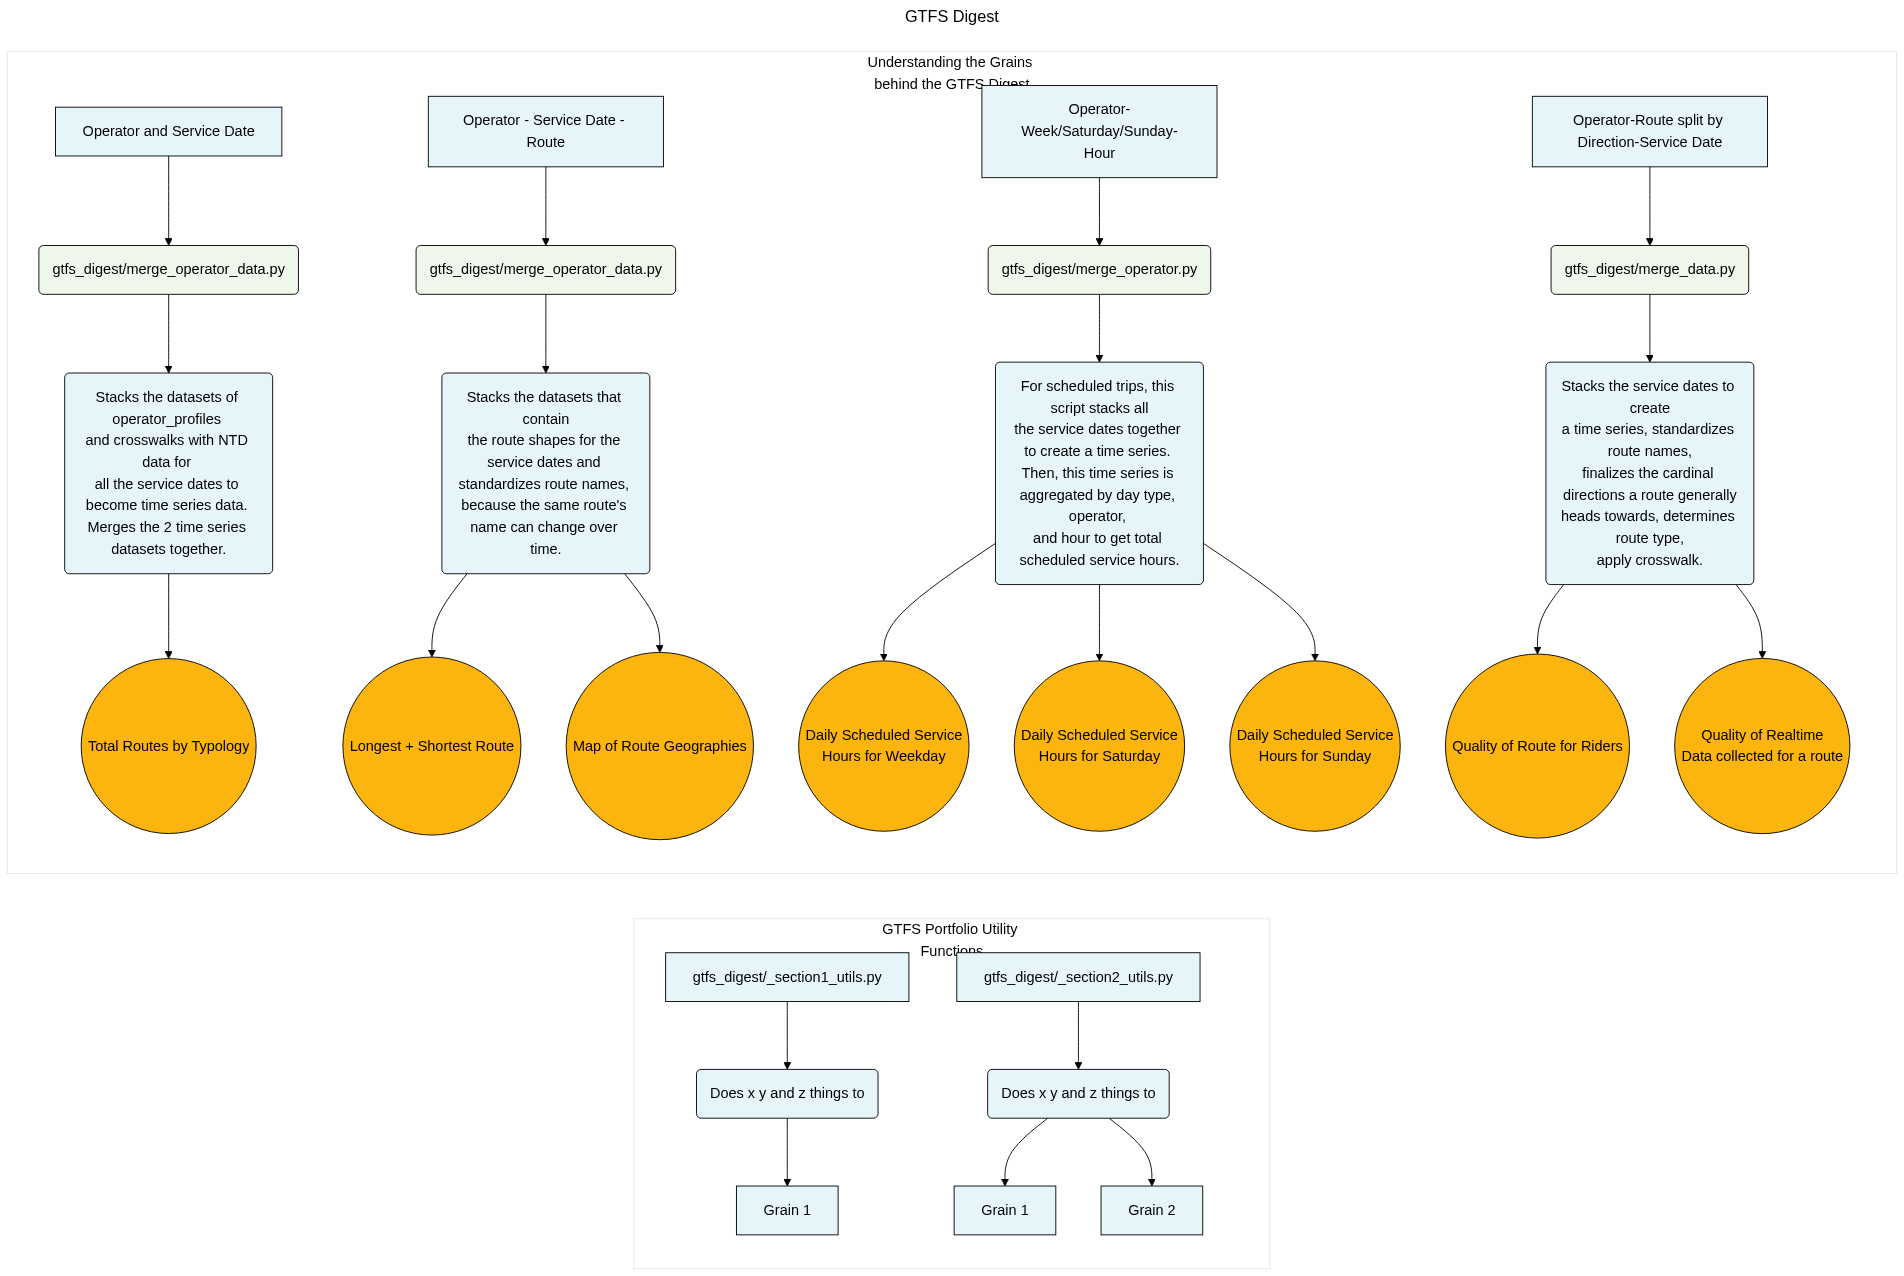
To download all of the processed data that powers this portfolio, please navigate to the folder titled gtfs_digest here. You will find the most recent datasets in .parquet, .csv,.geojson formats. Match the readable column names to the table names. The data pulled from the Federal Transit Administration’s National Transit Data is located here.
Who We Are#
This website was created by the California Department of Transportation’s Division of Data and Digital Services. We are a group of data analysts and scientists who analyze transportation data, such as General Transit Feed Specification (GTFS) data, or data from funding programs such as the Active Transportation Program. Our goal is to transform messy and indecipherable original datasets into usable, customer-friendly products to better the transportation landscape. For more of our work, visit our portfolio.
![]()
![]()
Caltrans®, the California Department of Transportation® and the Caltrans logo are registered service marks of the California Department of Transportation and may not be copied, distributed, displayed, reproduced or transmitted in any form without prior written permission from the California Department of Transportation.